
Does TV Show Quality Matter on Streaming? A Statistical Analysis
Does program quality impact streaming popularity? Or does low-quality content dominate on Netflix?


Introducing Stat Significant’s Interactive Culture Dashboards
Over the past few months, I’ve been building something new for Stat Significant: a suite of interactive data hubs designed to track culture in real time.
Paying subscribers now get access to a growing suite of continuously updated, interactive data pages—packed with charts and graphics—starting with:
The Streaming Report: tracking what people are actually watching on TV streaming platforms.
The Spotify Trend Report: a real-time view of the songs and artists dominating streaming, alongside older hits that refuse to fade.
A History of Popular Music: a deep dive into music history, Billboard chart performance, genre trends, one-hit wonders, and song composition.
Each page features interactive visuals that update daily or weekly, with underlying datasets often available for download. And this is just the beginning—I’m planning to delve into other subjects (YouTube, TikTok music data, movies, actors, etc.), and expand this group of pages in the coming weeks.
Today’s essay on TV quality uses data from The Streaming Report. Enjoy!
Intro: Is Ginny & Georgia a Real Show?
Everyone has a favorite conspiracy theory—an irrational belief they cling to, while knowing it’s (probably) false. Some people question the moon landing. Others insist Nelson Mandela died while in prison. While many “remember” the Monopoly Man having a monocle (even though he doesn’t).
As for me, I believe that Netflix’s mega-hit show Ginny & Georgia doesn’t actually exist. As far as I’m concerned, if you “believe” in Ginny & Georgia, you’ve fallen victim to an elaborate psy-op with no clear objective.
Several times a year, Netflix releases fresh Ginny & Georgia propaganda in an attempt to convince the masses that this series is (a) real and (b) widely watched. A few notable examples include:
Season one of Ginny & Georgia reached an estimated 52 million viewers in its first 28 days.
Season two of Ginny & Georgia racked up ~665 million viewing hours in the first half of 2023, making it Netflix’s second most-watched show during this time.
Apparently, Ginny & Georgia boasted Netflix’s highest season completion rate among viewers who started the show in 2023.
These statistics paint a portrait of a show beloved by tens of millions, yet in today’s streaming landscape, popularity doesn’t always translate into cultural relevance. Saturday Night Live took aim at this disconnect in a 2023 sketch called “Hollywood Quiz Show,” a fictional game show that asks everyday contestants to identify modern entertainment. Throughout the sketch, the host hints at contemporary streaming hits, and the contestants fail to name a single one, including a pointed jab at the relative anonymity of Ginny & Georgia:
In a streaming abyss of endless content, shared cultural recognition is increasingly elusive—even for Netflix’s biggest shows.
The perceived obscurity of a streamer’s “hits” has reinforced a common belief that the shows succeeding on streaming are low-quality—widely consumed and rarely acclaimed. The logic underlying this belief is simple: if you’ve never heard of Ginny & Georgia, it must be bad, and the people watching it have bad taste, while you, a discerning viewer, only consume high-quality content.
As more unheralded series populate Netflix’s Top 10, I, like many others, have started to question the relationship between program quality and popularity. Do critical acclaim and storytelling prowess actually matter on streaming? Or is Netflix’s vaunted Top 10 the product of pure randomness?
So today, we’ll investigate the relationship between artistic merit and television viewership, examining which series attract audiences on Netflix, Hulu, HBO Max, and beyond.
Does TV Show Quality Matter on Streaming?
For this analysis, we’ll draw on several views from Stat Significant’s Streaming Report—a new subscriber-only page that tracks the streaming landscape through automated dashboards. In these graphics, series quality is gauged via TMDB user ratings, while streaming popularity is measured using three years of Nielsen weekly Top 10 data.
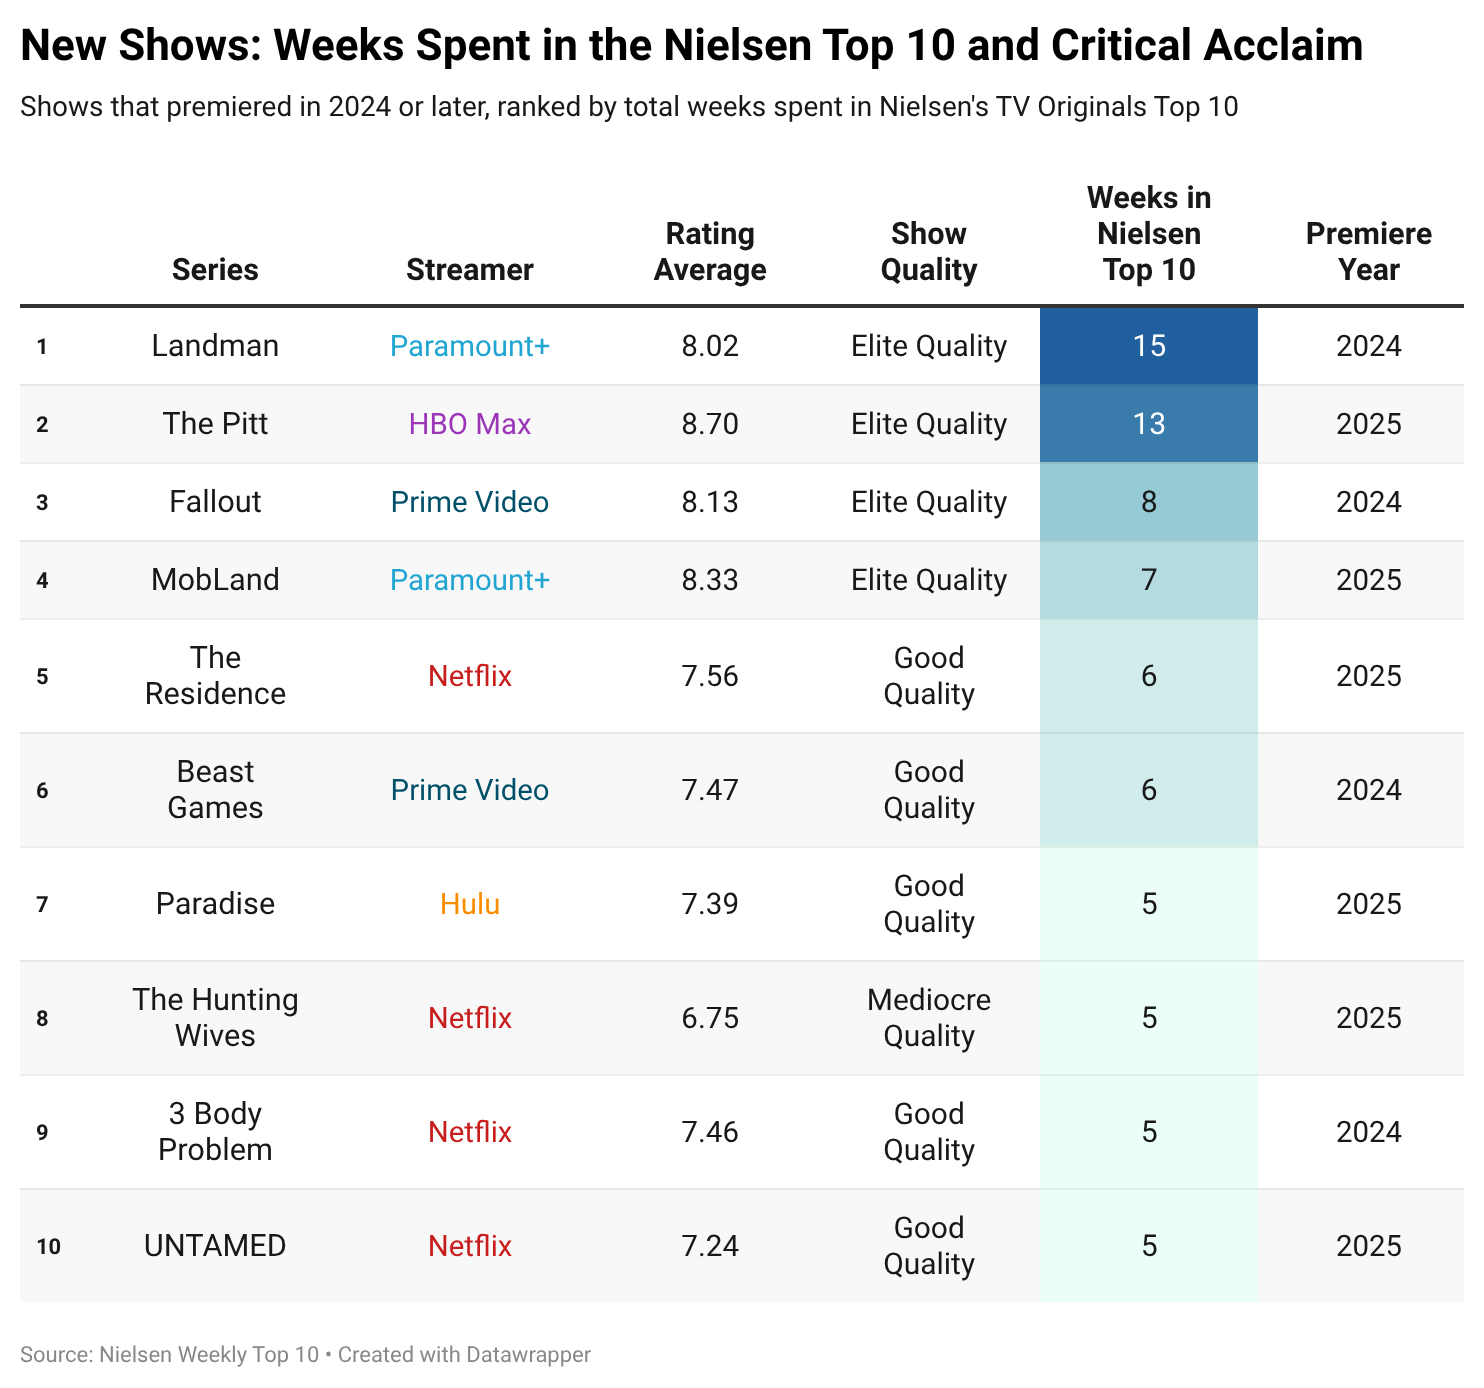
To illustrate how this scoring works, we’ll examine a small sample of series from our dataset that spent multiple weeks in Nielsen’s Top 10, along with their assigned quality tiers. This list is topped by a handful of “elite” programs that earned critical acclaim and were consistent fixtures on the weekly charts, such as Landman, The Pitt, and Fallout.
When we group our full dataset of shows by quality and calculate the share of titles that reached Nielsen’s Weekly Top 10, a clear pattern emerges: “good” series appear most often, while “excellent” and “elite” programs show up less frequently.
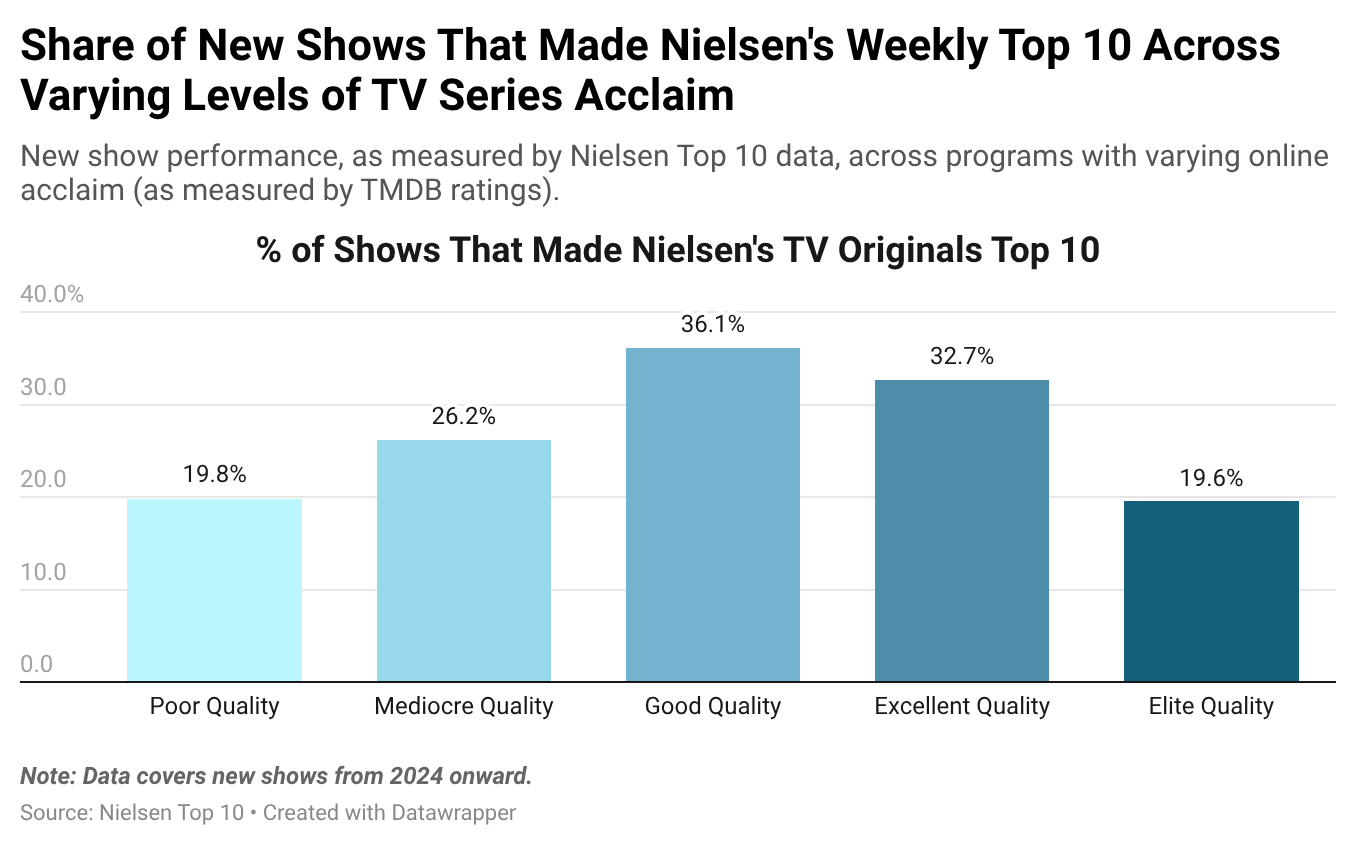
Yikes! If you’re the type of cynic who loves declaring that we live in a “dead culture” without fully understanding what the term means, then you can stop here. Congratulations, you’ve got your sound bite.
Yet reaching the Nielsen charts is only half the battle. When we consider program viewership, a show’s audience is typically the product of two interrelated phenomena:
Reach: How many people are predisposed to watch the series? This may stem from the title’s presence on Netflix or a story’s roots in beloved intellectual property with a preexisting fanbase.
Longevity (often referred to as “legs”): Whether viewers stick with a show through all its episodes—and whether that program gains momentum through word of mouth.
In my opinion, making Nielsen’s Top 10 suggests meaningful reach. A show can be widely sampled—perhaps it’s trending on Hulu or HBO Max for a few days—but that doesn’t indicate longevity. So what does?
To ascertain cultural staying power, we’ll examine how long a program remains in Nielsen’s Top 10 and the total viewership hours reported by Nielsen while it’s on the charts.
When we repeat our quality bucketing exercise, we find that well-reviewed programs—like The Pitt, Fallout, Stranger Things, Squid Game, and Landman—remain on the charts significantly longer than lower-rated titles.
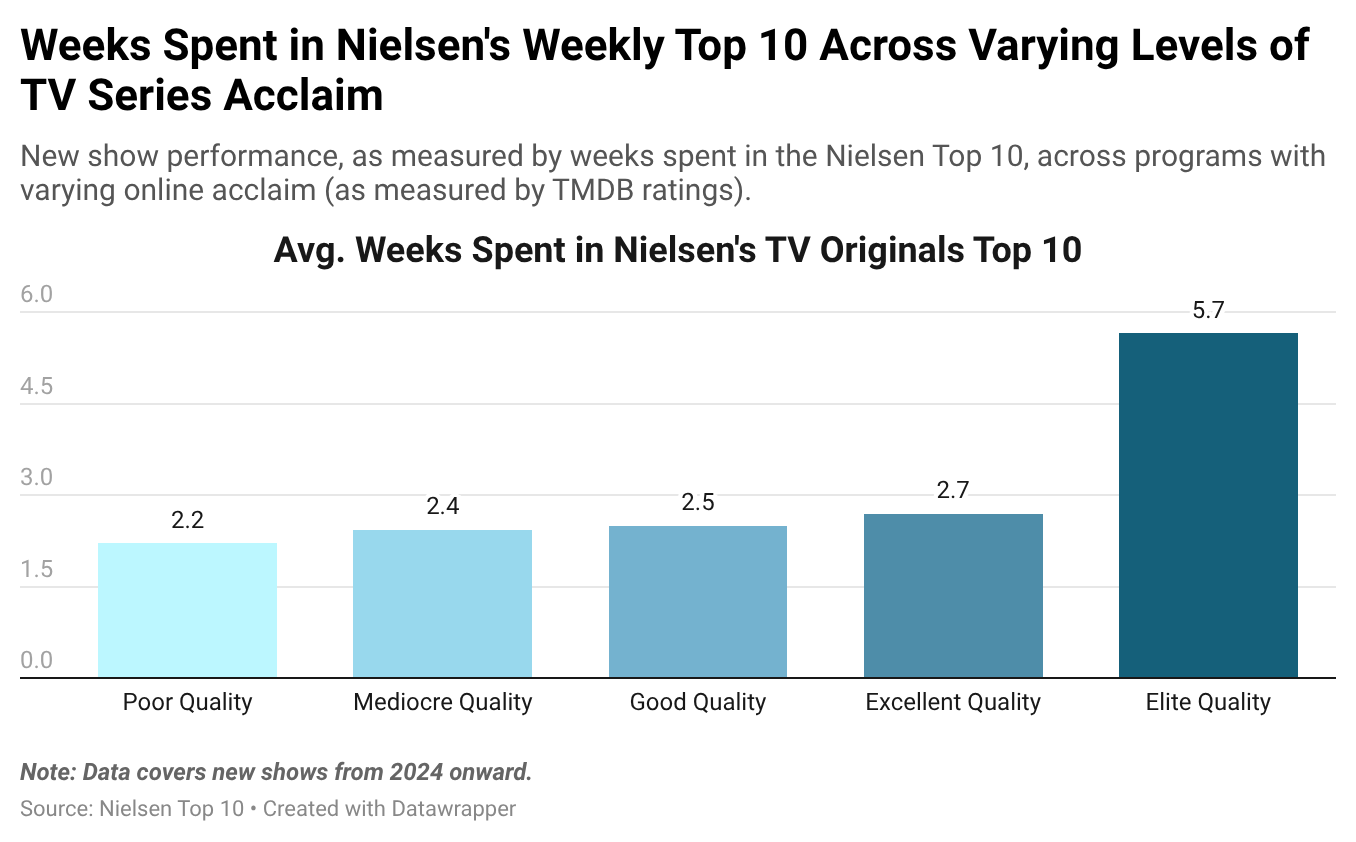
But wait, there’s more: shows that garner online acclaim generate significantly more viewing hours—nearly four times as much—when they appear on the Nielsen charts.
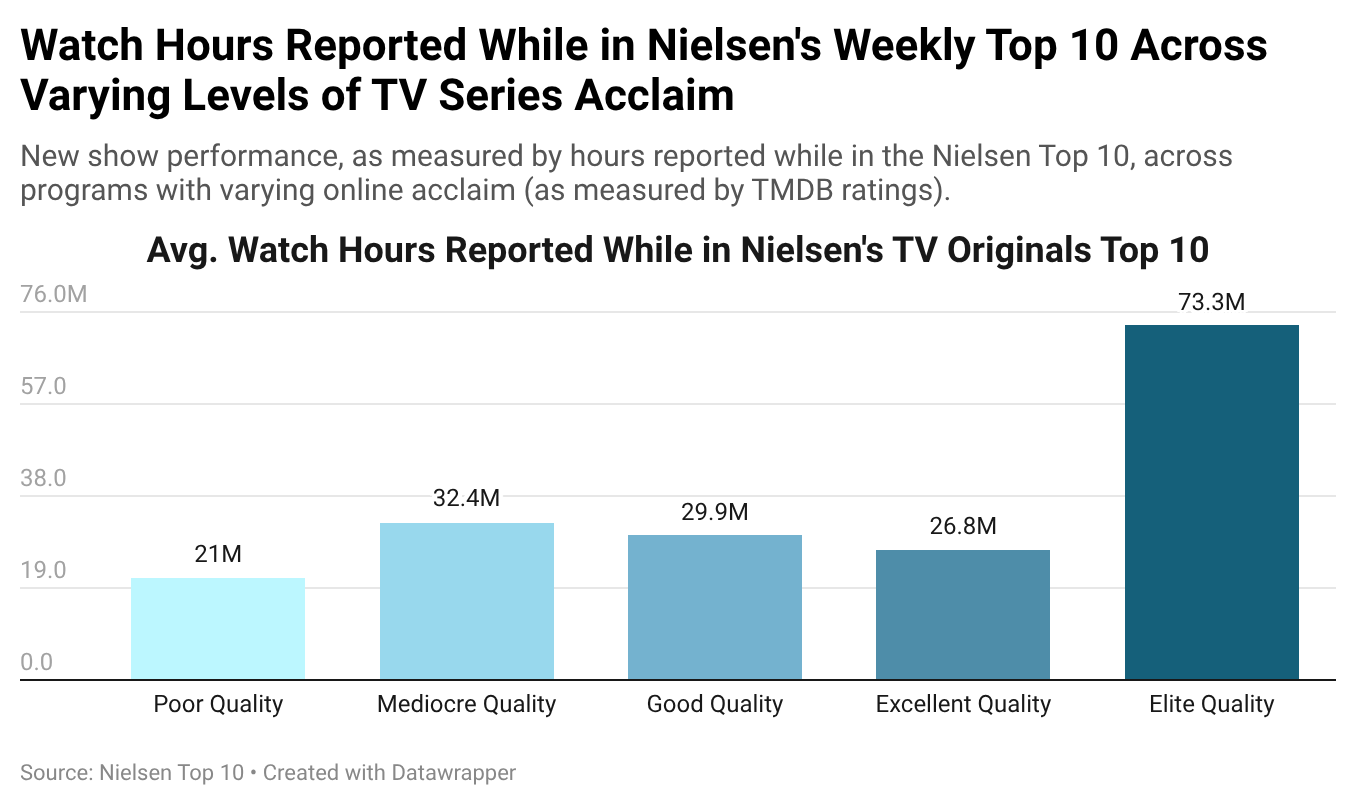
In short: Hooray, quality matters. Maybe our culture isn’t so “dead” after all! 🙌 And notably, this pattern holds even when isolating the data to Netflix titles—meaning quality matters on Netflix, too.
The next question is how we reconcile our findings: do these incentives push us toward mediocre programming that will make the charts, or to prestige content that may possess stronger word-of-mouth? Ultimately, the tradeoff boils down to an oversimplified equation that goes something like: [Expected Program Value] = [Reach] x [Longevity]
For those doing the math, this calculus favors the elite TV show. The entertainment industry has been, and always will be, heavily reliant on outliers—like a summer blockbuster or Oscar winner—and TV shows are no exception. A well-reviewed program like Adolescence is not predisposed to significant reach—compared to a superhero series or a video game adaptation—but if this show can break through and garner exceptional word-of-mouth, then it will stay on the charts for many weeks.
So how should our findings impact show development? If you’re a studio executive and you’re programming the perfect Q4 slate 🙌, what should you do?
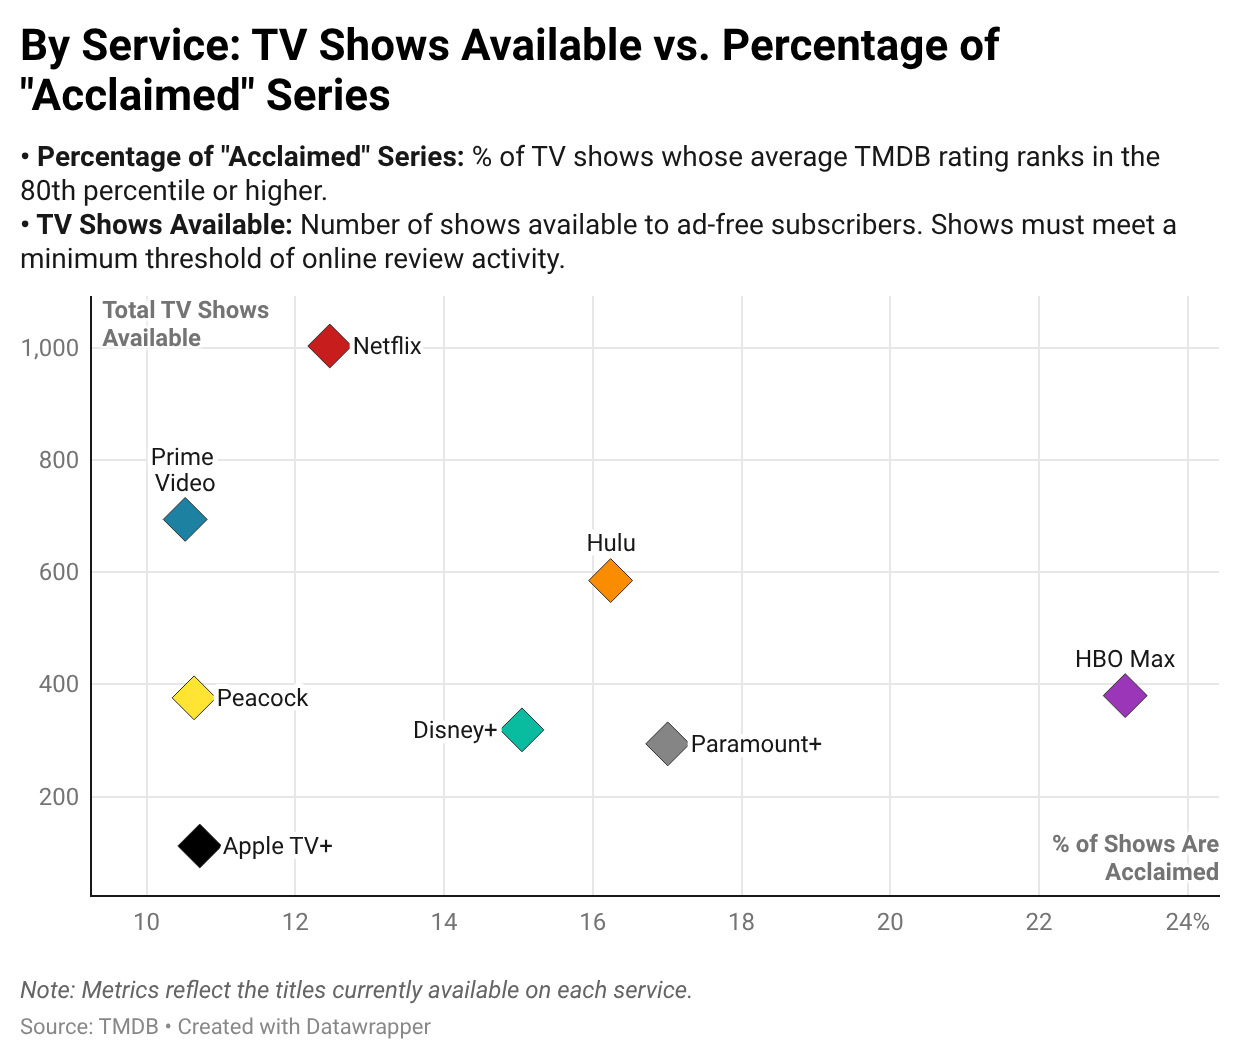
To understand how streamers balance quality versus quantity, we’ll evaluate TV catalog strength by platform using one of our new Streaming Report views. The graph below displays a 2x2 comparison of library breadth (measured by number of programs available, for shows with a minimum number of TMDB reviews) vs. the percentage of these titles that are “acclaimed.”
According to this view, Netflix offers the largest TV catalog, HBO Max boasts the highest “hit rate” for high-quality programming (because it’s not TV—it’s HBO!), and Netflix ultimately delivers the greatest absolute number of high-quality series due to its scale.
So is the answer to the question of “which programming” just “as many shows as humanly possible”? Kind of.
What I can’t display here—and what is perhaps most crucial to content development—is capital investment.
When I worked at DoorDash, we roughly segmented restaurants into (1) highly valuable outliers and (2) merchants of average popularity. If you’re thinking purely in terms of a single cuisine, this might mean assigning your best salespeople to a single buzzy Greek restaurant that is disproportionately popular in San Francisco, and your second-tier sales reps to the 20 less-heralded Greek places. You need breadth—to give people as many Greek options as possible—while also getting the one special restaurant that you can build marketing campaigns around.
The same logic applies to streaming. Spend more money on prestige fare—like the final season of Stranger Things—and less money on run-of-the-mill content that will fill out your catalog—such as true crime, reality dating shows, and Is It Cake?.
Final Thoughts: Consecrating Mediocrity

Coverage of the entertainment industry has always skewed hypercritical. For frame of reference, consider this collection of pundit pull quotes in the run-up to a particularly contentious Oscar year:
Pauline Kael (The New Yorker): “The Academy Awards are a consecration of mediocrity.”
Vincent Camby (The New York Times): “The nominations…suggest not so much a vintage year as a confused one.”
Judith Crist (ABC News): “Another year, another batch of questionable choices.”
Sounds like a ceremony celebrating a grab bag of big-time stinkers, right? Wrong! So very wrong.
In fact, the 1975 Oscars saw Best Picture nominations go to The Godfather Part II, Chinatown, and The Conversation, among others. Today, these films are widely regarded as all-time classics—cornerstones of the much-mythologized New Hollywood canon, alongside Taxi Driver, American Graffiti, Apocalypse Now, and One Flew Over the Cuckoo’s Nest.
In retrospect, the mid-1970s are remembered not as a period of decline, but as a creative high-water mark—an era when commercial filmmaking and artistic ambition aligned.
The critics of 1975 didn’t realize how good they had it—a classic case of rosy retrospection (or “golden age thinking”), the tendency to view the present as broken while idealizing the past. This bias is evergreen. We fixate on what’s mediocre or disappointing, overlooking the broader foundation that makes those critiques possible in the first place.
Throughout this analysis, I was struck by two findings:
First, the sheer volume of well-regarded television released in just the past two years is remarkable.
Second, the industry’s economic incentives are meaningfully aligned with artistic ambition (prestige still pays). Put differently, we don’t realize how good we have it.
If you could drop a television viewer from 1975 into today’s landscape—handing them The Pitt, Squid Game, and Stranger Things—they’d be stunned by the TV content we receive for $9.99 a month (without ads!).
There will always be middling television shows—just as there have always been middling movies, plays, and songs—but we’re far from living in a “dead” culture that consecrates mediocrity. Even if Ginny & Georgia does exist—and is both bad and widely watched—there are just as many counterexamples that showcase television at its best.
Want more data like this?
Become a paying subscriber for interactive dashboards, free datasets, and to support independent data journalism.
Paying subscribers get:
The Stat Significant Dataset Hub (Updated Weekly): a collection of free datasets across movies, music, TV, cultural trends, and economics.
Interactive Data Hubs:
The Streaming Report: what people are watching on streaming.
The Spotify Trend Report: the songs and artists dominating Spotify.
Pop Music History: a deep dive into music history, Billboard chart performance, genre trends, and song composition.
Get access with:
*Note: For best results, open this link in a web browser while logged in to your Substack account.
Want to promote your data tool or media publication to Stat Significant’s 24,800 readers? Email daniel@statsignificant.com
Need help with a data problem? Book a free data consultation
Connect with me on LinkedIn if you want to chat about a data project.
Like movies? Follow me on Letterboxd
Great analysis!
Quality still wins